Infrastructure
Ice Melt Management at Wilkins Aerodrome
Australian Antarctic Division
linkedin/beadedstream
844.488.4880
www.beadedstream.com
contact@beadedstream.com
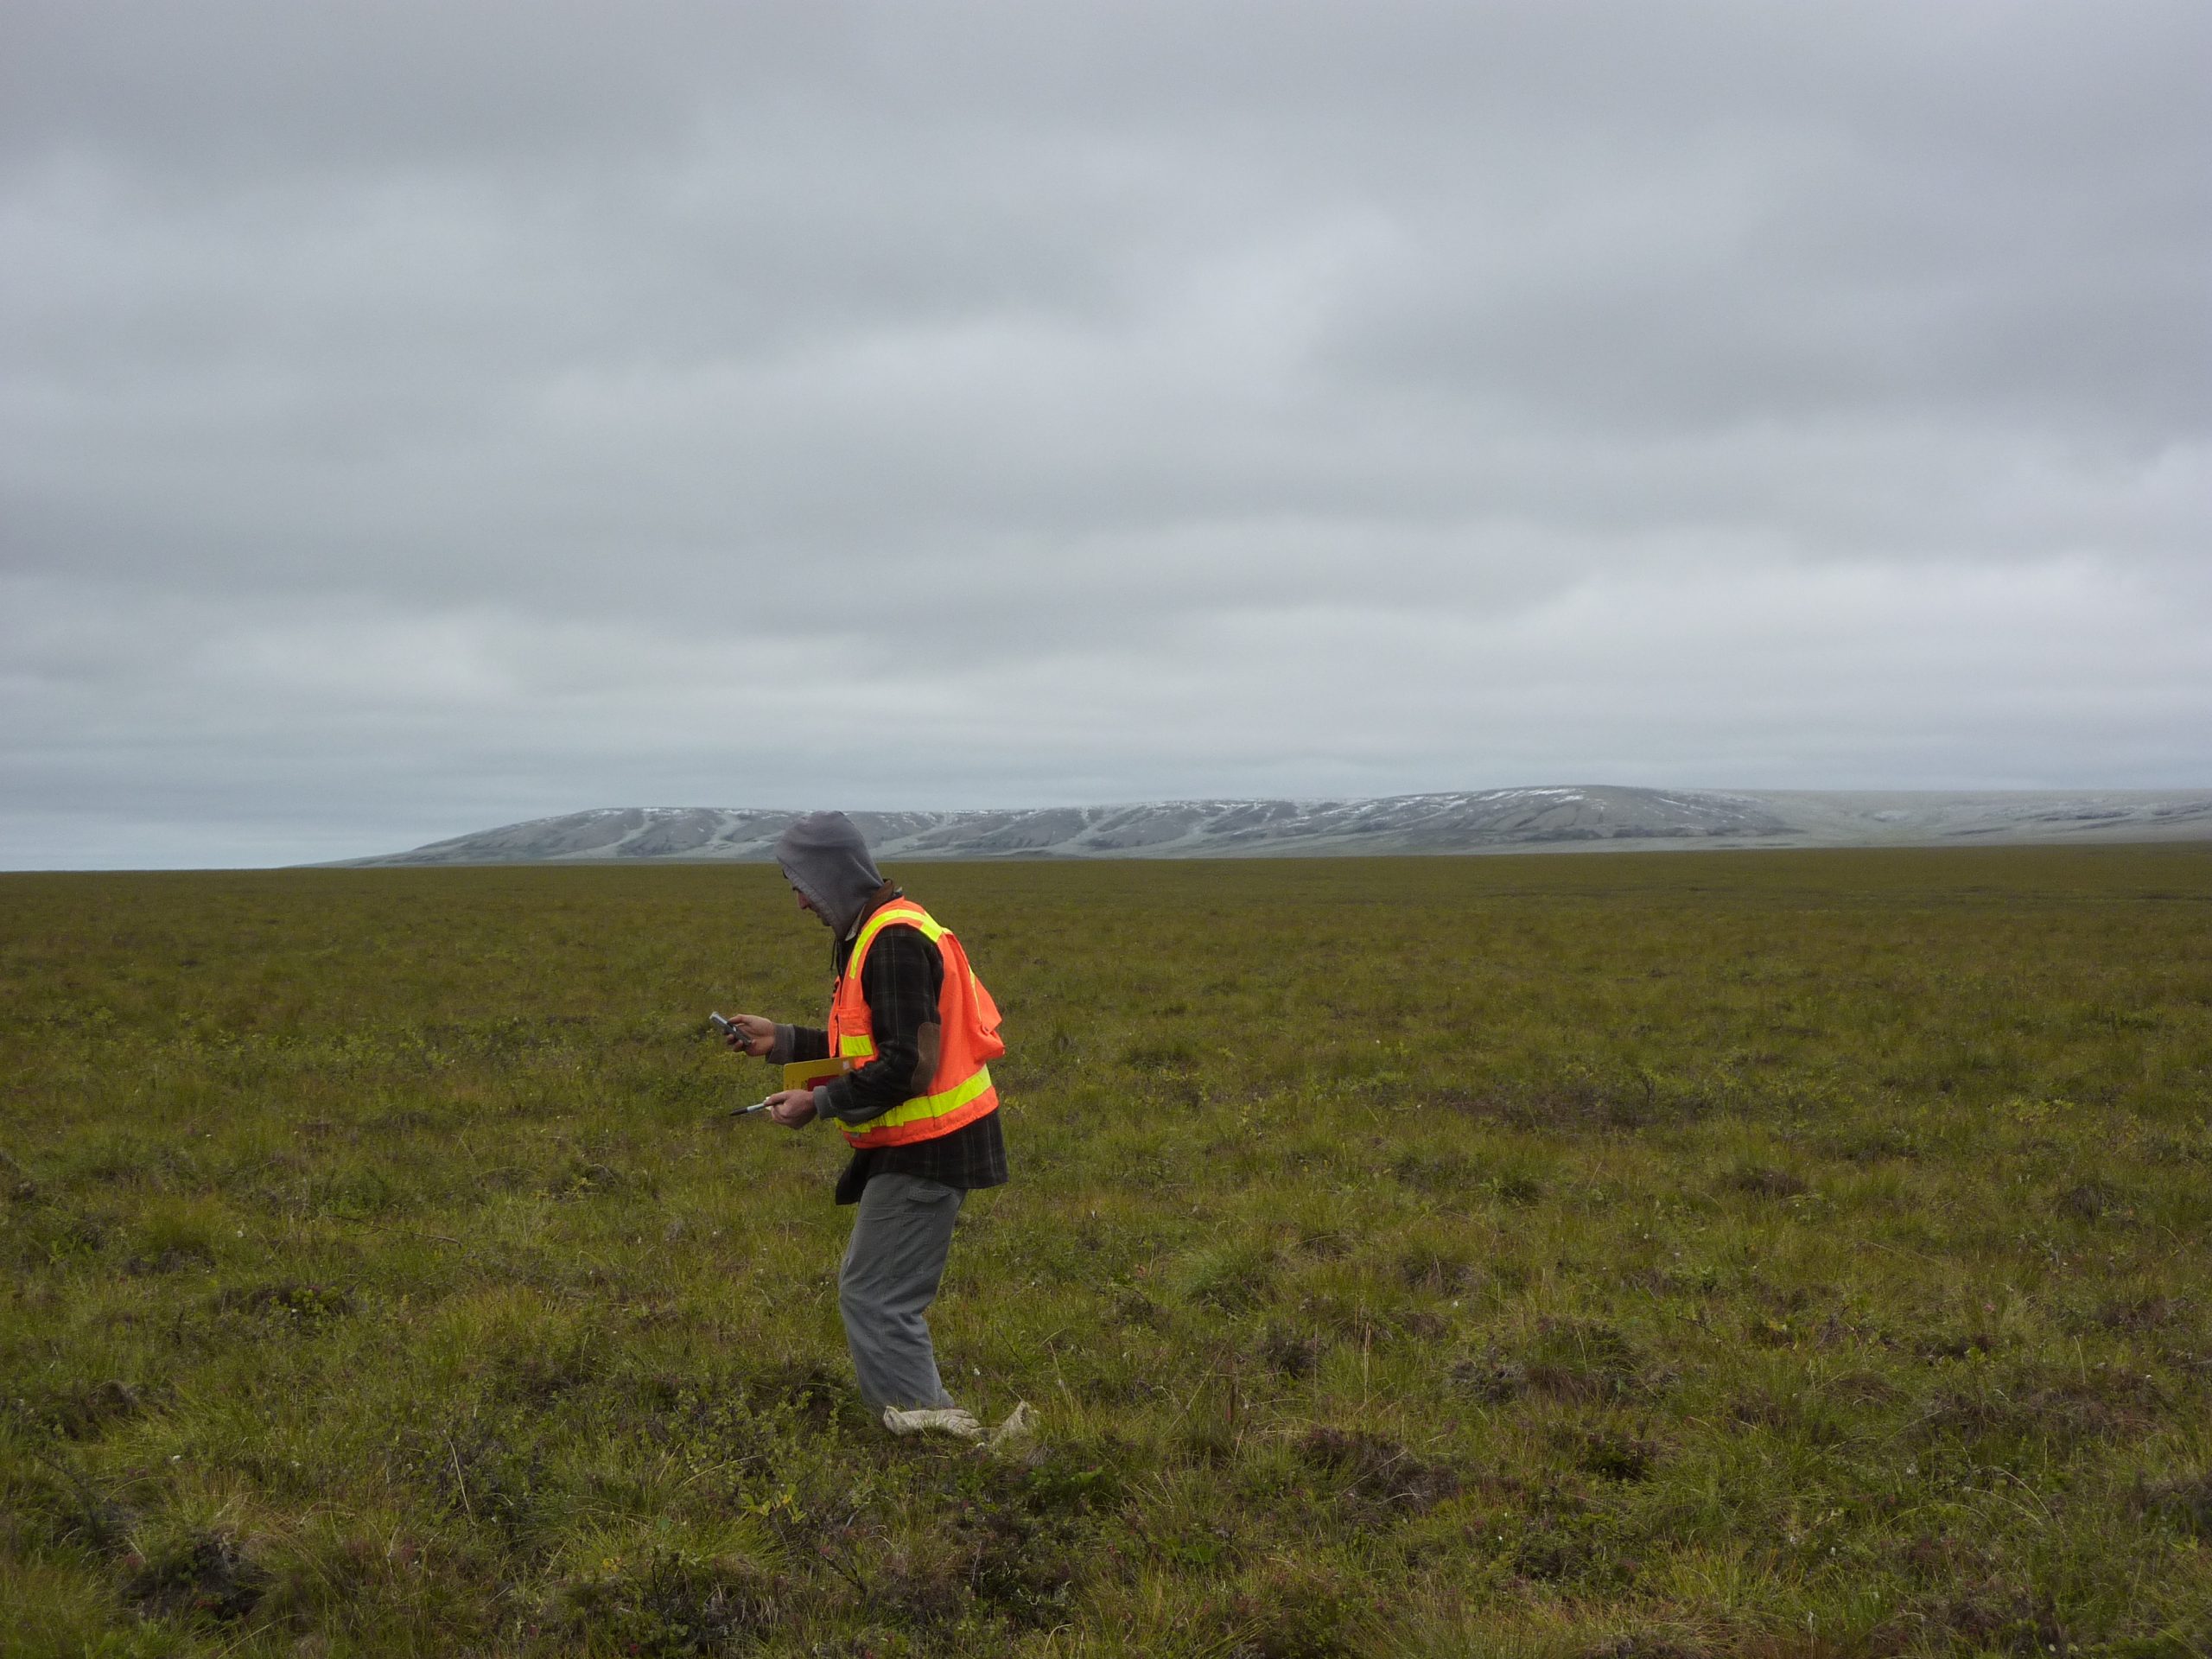
Located approximately 70 km southeast of Casey Station in the Antarctic Australian territory, the Wilkins Aerodrome stands as a critical gateway to Antarctica. Serving as Australia’s primary aerodrome for intercontinental air service since 2007, it plays a pivotal role in facilitating scientific research and logistical operations in one of the world’s most extreme environments. However, the aerodrome faced formidable challenges due to its unique location atop glacial ice, including significant annual shifts and temperature fluctuations that posed operational risks. Recognizing the need for a more efficient and comprehensive solution, aerodrome operators turned to beadedstream for assistance.
Click for an instant live demo of the beadedcloud data dashboard for FREE.
Free DemoApplication
Wilkins Aerodrome plays a pivotal role in enabling scientific exploration and logistical operations in Antarctica, catering to the needs of researchers, workers, and logistical teams. Maintaining the reliability and safety of operations in such an extreme environment is essential for the success of Antarctic missions. Yet, the dynamic nature of the icy runway demanded innovative solutions to optimize operational efficiency and ensure safety.
beadedstream Solution
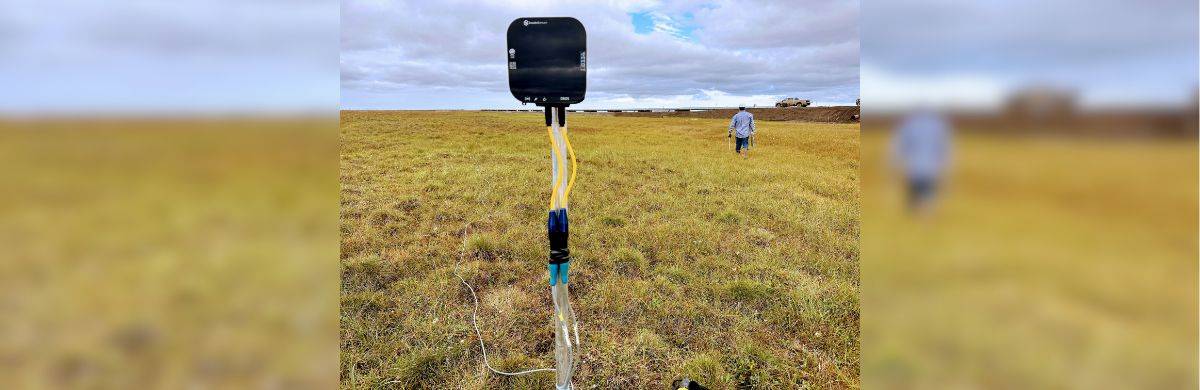
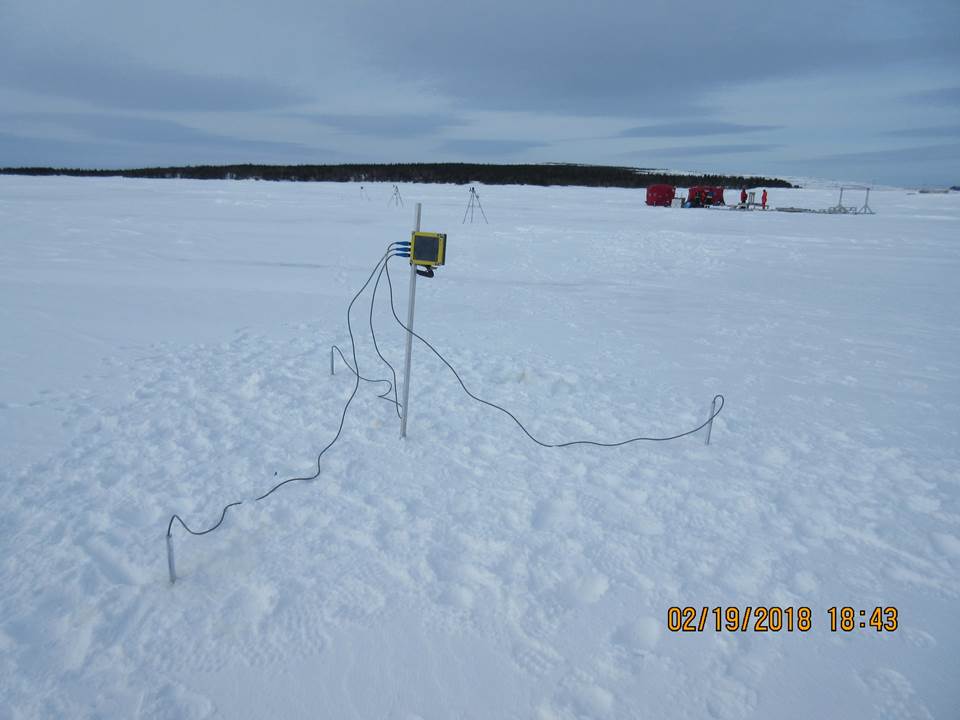
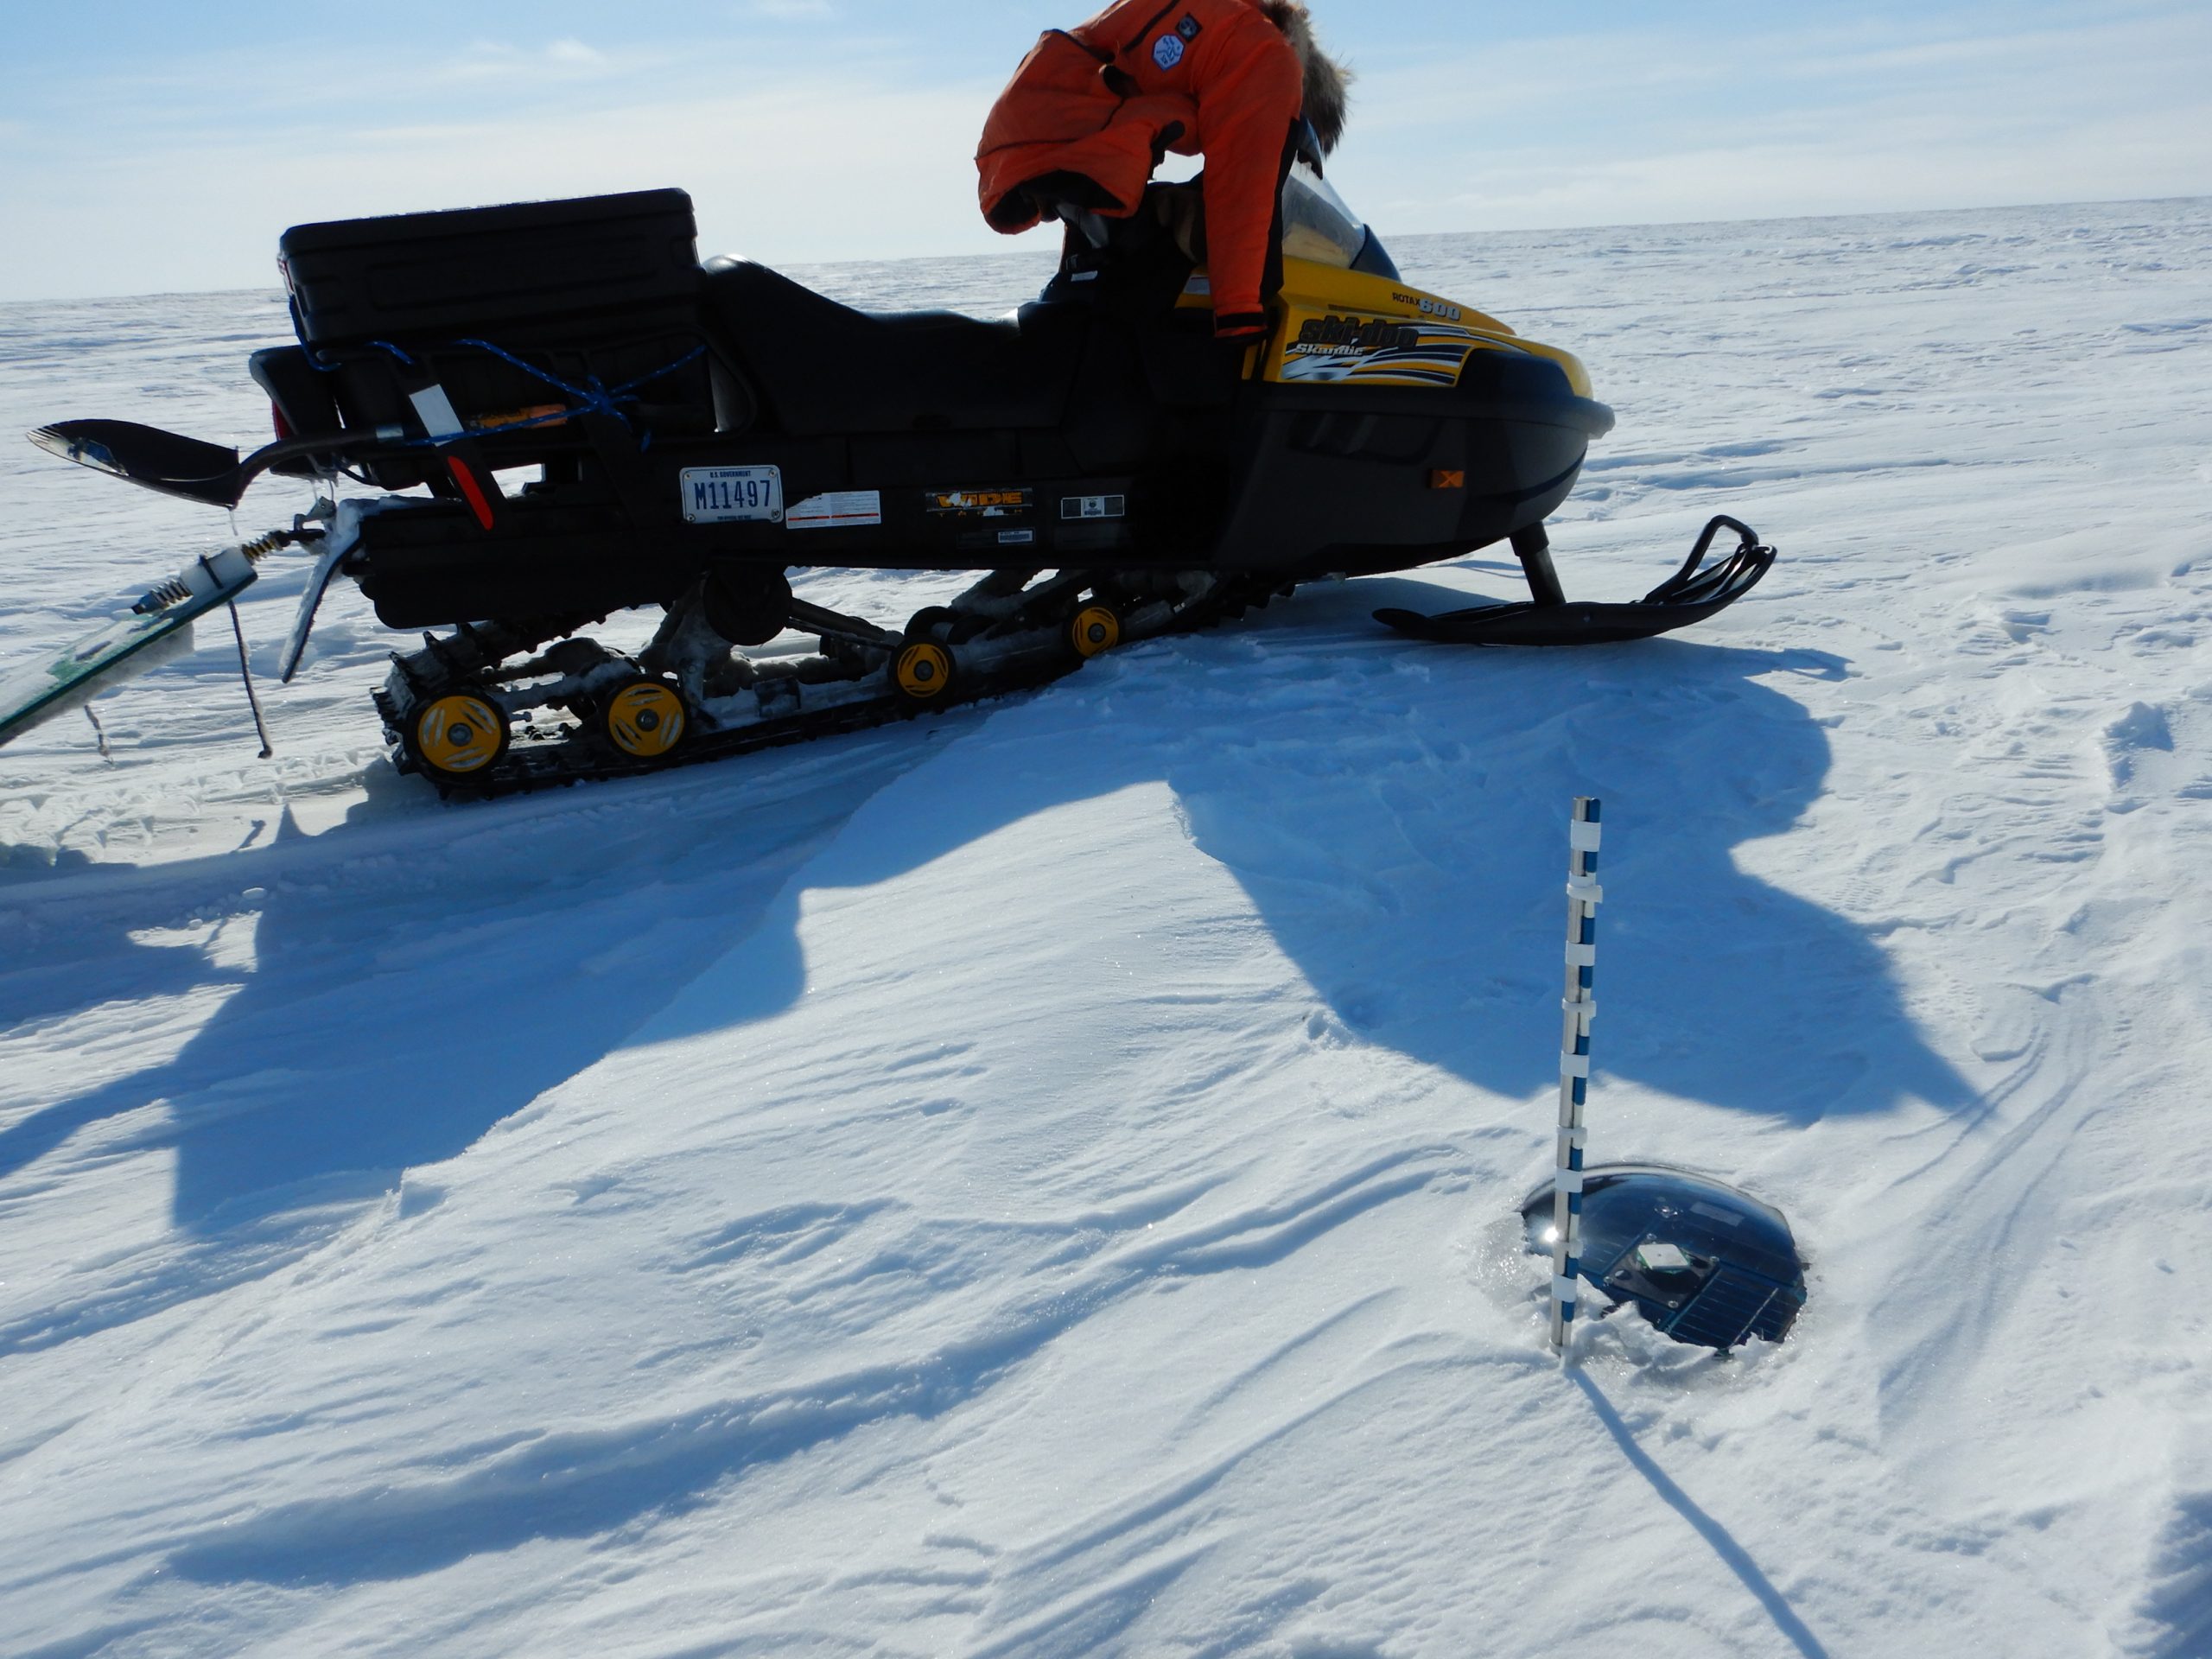
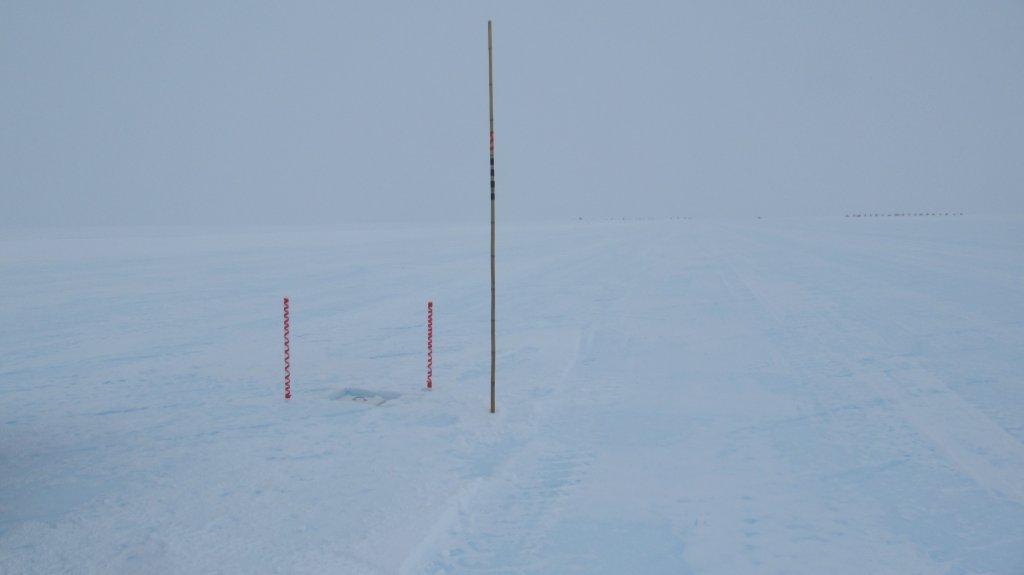
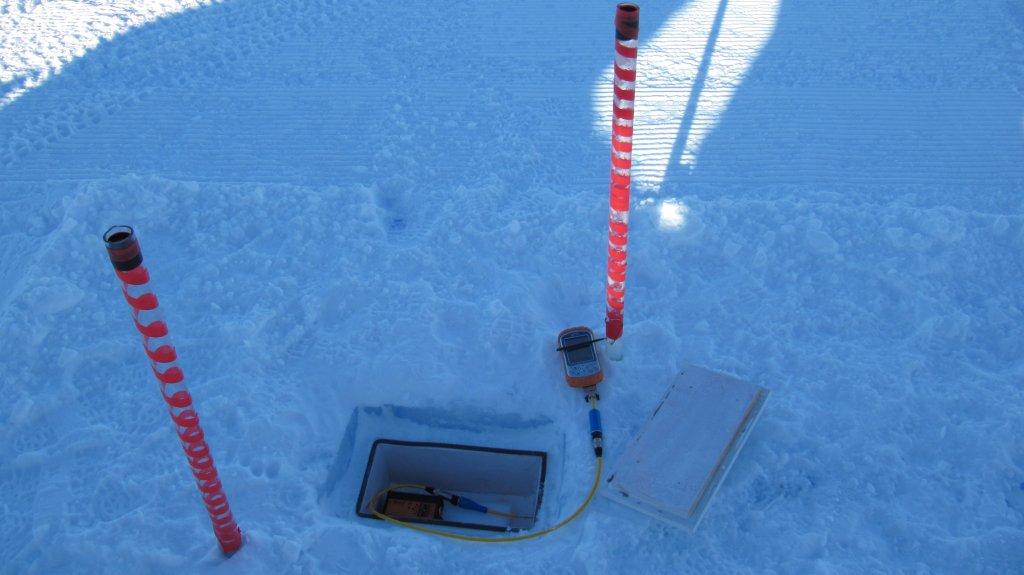
In response to the aerodrome’s need for precise and continuous temperature monitoring, beadedstream engineered an innovative solution tailored to Wilkins Aerodrome’s requirements. In the summer of 2010, beadedstream deployed 12 digital temperature cables, each connected to a DL230 Data Logger, along the 3,600-meter long runway, strategically positioned at approximately 6 locations. These cables, designed for vertical insertion into the ice, utilized two configurations to measure temperatures at varying depths – 1 meter and 1.5 meters. Each cable was equipped with sensors, with the 1-meter variant featuring 8 sensors within its 0.95 m (3.12 ft) length and the 1.5-meter variant equipped with 10 sensors along its 1.45 m (4.76 ft) length.
In 2013, to enhance their monitoring capabilities, they purchased 3 additional 13-meter instrumented cables, each equipped with 34 sensors. They also acquired a D405 satellite data logger and a D401 standalone data logger to facilitate data collection and transmission.
In 2023, to further expand their monitoring network, they procured 10 more 1-meter cables, ensuring comprehensive temperature data across the entire runway.
beadedstream Solution Benefits
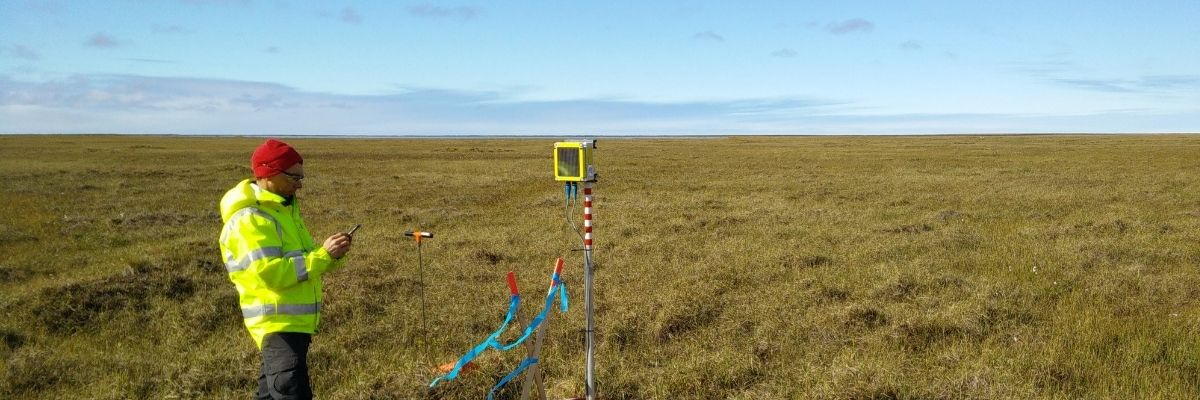
The implementation of beadedstream’s advanced temperature monitoring system revolutionized operations at Wilkins Aerodrome, offering unparalleled insights and benefits. By replacing manual temperature measurements with automated data collection, aerodrome authorities gained real-time visibility into runway conditions, enabling swift decision-making and enhancing operational efficiency. Furthermore, the comprehensive datasets generated by beadedstream’s technology empowered facility managers to analyze temperature trends over time, facilitating proactive maintenance and optimizing operational planning.
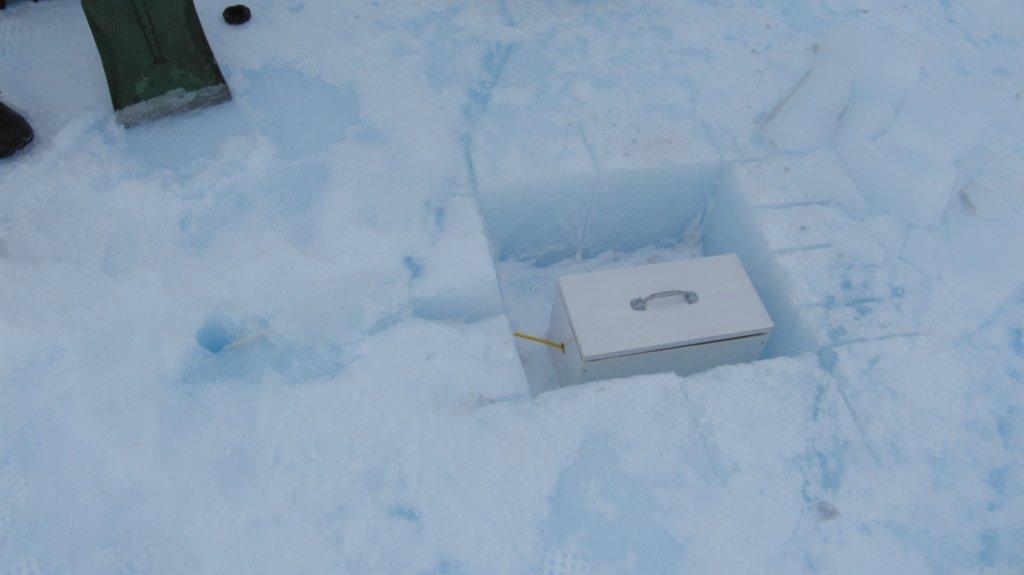
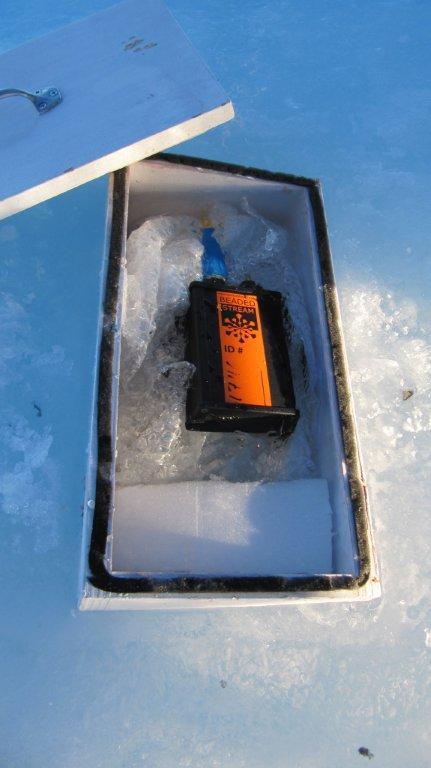
Additionally, beadedstream’s solution provided versatility and adaptability, with the ability to monitor temperature variations at different depths, ensuring comprehensive coverage of runway conditions. The integration of data loggers, housed in custom-built boxes along the runway, further streamlined data collection and analysis, enhancing overall system efficiency.
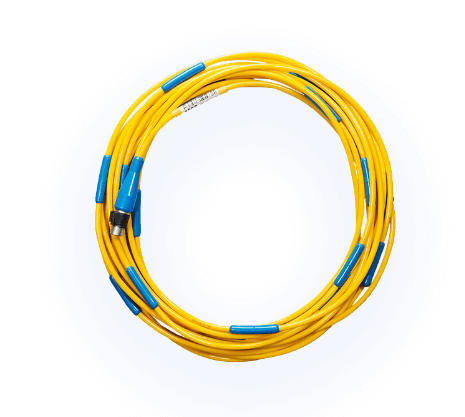
Featured Product
Digital Temperature Cable (DTC)
Start collecting high quality temperature data from your wet, dirty, frozen world in no time. beadedstream Digital Temperature Cables (DTC)s are purpose built to survive harsh conditions and last. DTCs plug into beadedstream connectivity products such as the D505, D605, and Torpedo 2. And since beadedstream cables are fully digital, connecting to most third party loggers or existing automation and SCADA networks is easy. Get accurate, highly resolved measurements for air, soil, or water temperature. Down a hole, on a mountainside, under a road, through a dam, in a lake, use beadedstream cables wherever you need reliable temperature measurement.
View ProductExplore Our Most
Recent Case Studies
Learn about our most recent projects and how beadedstream’s products were deployed.